
See metrics, logs, and traces in one place
Monitor your applications, infrastructure, and network in real time with unified insights, proactive alerts, and faster debugging across every service.
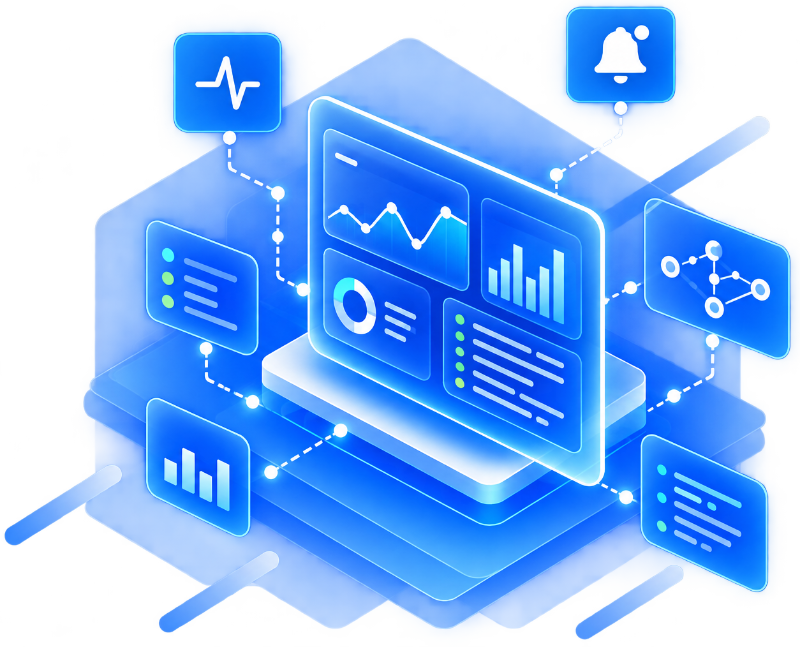
Unified metrics, logs, and traces
Full-stack observability built for sub-second query performance and actionable telemetry
Sub-Second Queries
Query petabytes of distributed log streams and high-cardinality tags in under 100ms.

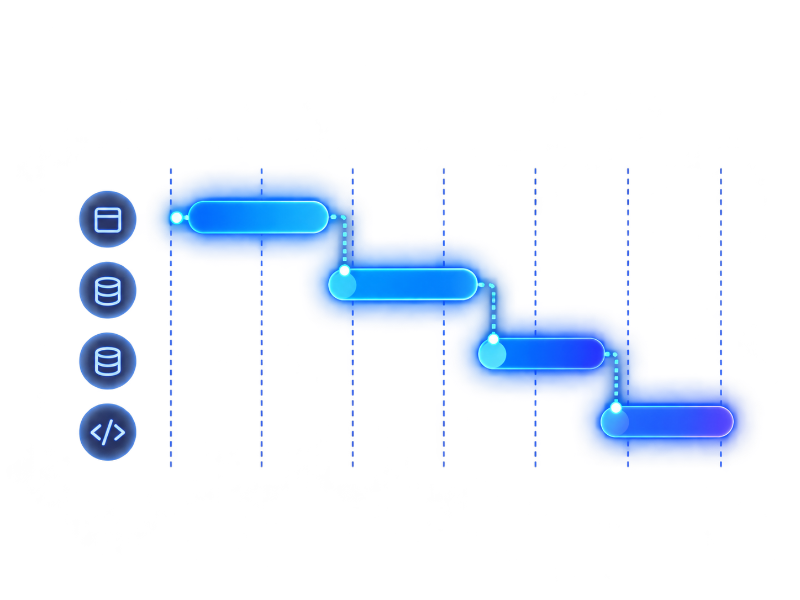
Waterfall APM Traces
End-to-end distributed span waterfall correlation from client browser to backend SQL.
Anomaly Detection
Machine-learning alert thresholds detect regressions before your customers report them.

OpenTelemetry Native
Zero proprietary agents. Ingest data seamlessly with standard OTel SDKs and OTLP endpoints.
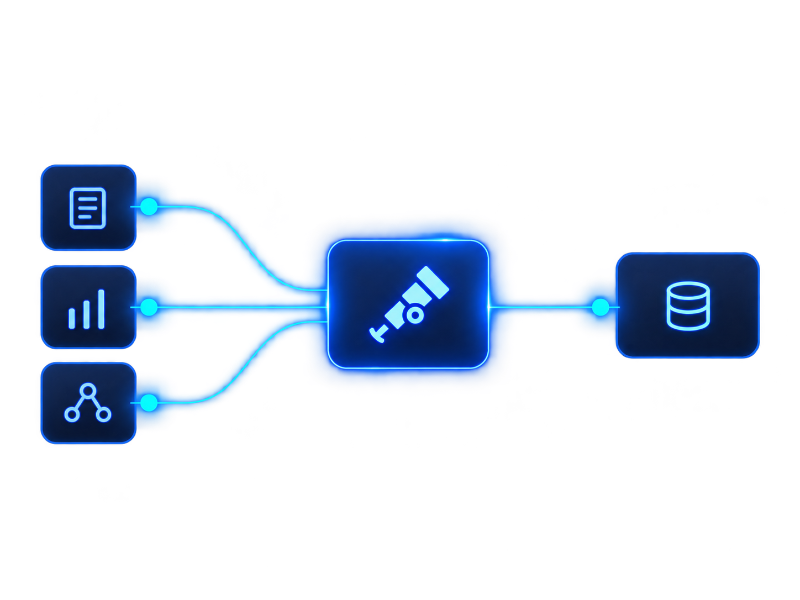
Single Pane of Glass
Click any error log to jump directly into the exact distributed trace and system metrics.
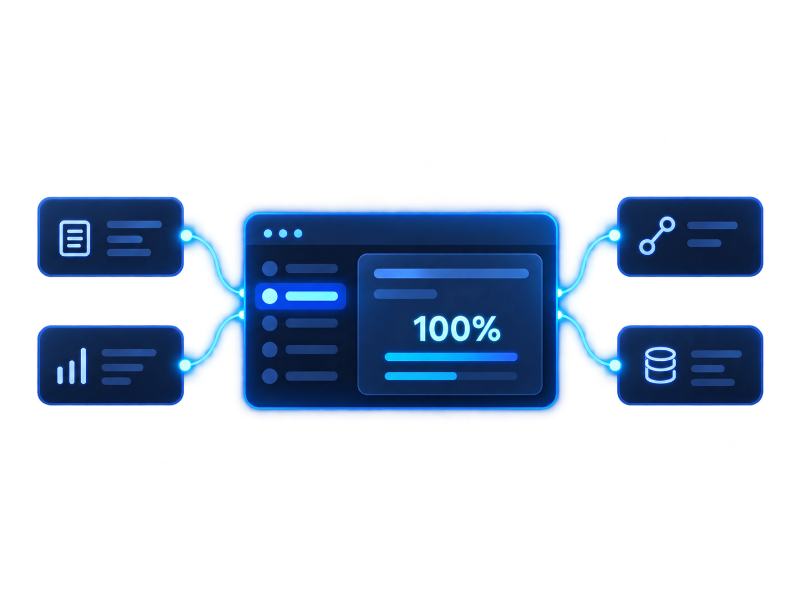
Superno is
full-stack observability
reimagined
Complete end-to-end visibility across all cloud infrastructure
Superno unifies metrics, logs, and APM traces into a single pane of glass. Correlate spikes in latency directly with container logs, SQL queries, or edge network bandwidth in real time.
Live log streaming with instant Regex filtering and tag facets
Automated service dependency maps and proactive latency alerts
Pay strictly for ingested telemetry. Zero seat charges.
No per-seat licenses, no user limits, and no hidden ingestion fees. Invite your entire engineering team and pay strictly for the gigabytes you ingest.
Logs & Metrics Ingestion
Structured logs, system metrics, and real-time live tail with automated indexing and regex search.
Full APM & Traces
Most PopularEnd-to-end distributed tracing, service topology graphs, and automated anomaly detection.
Extended Retention
Compliant cold tier storage for audit logs and security forensics with up to 365 days retention.
Estimate your monthly Observability cost
Free tier (10 GB ingested telemetry + 7-day retention) automatically applied.
Frequently Asked Questions
Yes. Superno is natively built on the OpenTelemetry (OTel) standard. You can ingest metrics, traces, and structured logs using standard OTel SDKs, OpenTelemetry Collectors, Prometheus scrapers, and fluentbit agents with zero proprietary lock-in.